
Real time electricity monitoring
Electricity Monitoring
I thought it would be a fun project to monitor my electricity usage and get an idea of the changes in our usage patterns over time. Unfortunately our meter is not a smart meter, its a Landis & Gyr E350. I did find a guide on building your own optical probe for meter reading but didn’t want to interact with the meter and I especially wanted to avoid triggering the tamper alarm!
After a bit of googling I came across this guide for monitoring usage by pulse counting and decided that would be a good a method to use. I knew I had a photo resistor and a spare Pi which I originally thought would be a good choice as the brains of the operation.
To confirm my approach I pulled up the guide that came with my ardunio kit (where the photo resistor originated) to see what was involved in getting connecting it up and reading its value. This is where I discovered that reading the resistor required a analogue input pin, something that the Raspberry Pi does not have. I had an ardunio to spare but really wanted to store this data somewhere on my NAS so I needed WiFi connectivity. Although I could have added a Analogue to Digital converter IC and attached that the Pi I decided that it was overkill to have an entire Pi dedicated to watching a single LED flash.
I looked around to find a developement board that had the WiFi capabilities I was after as well as an analogue input pin and came across several options:
- Adafruit Feather Huzzah - However Pimoroni were out of stock and I discovered that the analogue pin could only manage a maximum of 1 volt and I did not want to worry about that.
- Sparkfun ESP8266 Thing this looked pretty good but at the time I thought I needed an FTDI device to program it (maybe I was looking at a different SKU?).
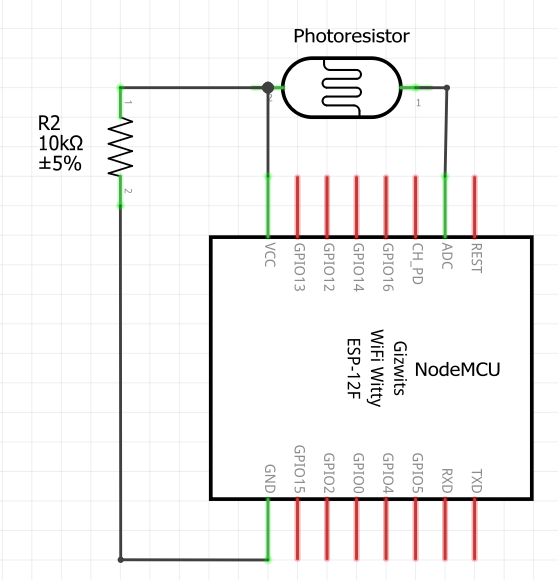
- NodeMCU - This is the board I settled on, its cheap, works with the Ardunio IDE, has WiFi and an analogue input pin.
Wiring up the hardware
With my new NodeMCU in hand I soldered up the following circuit:
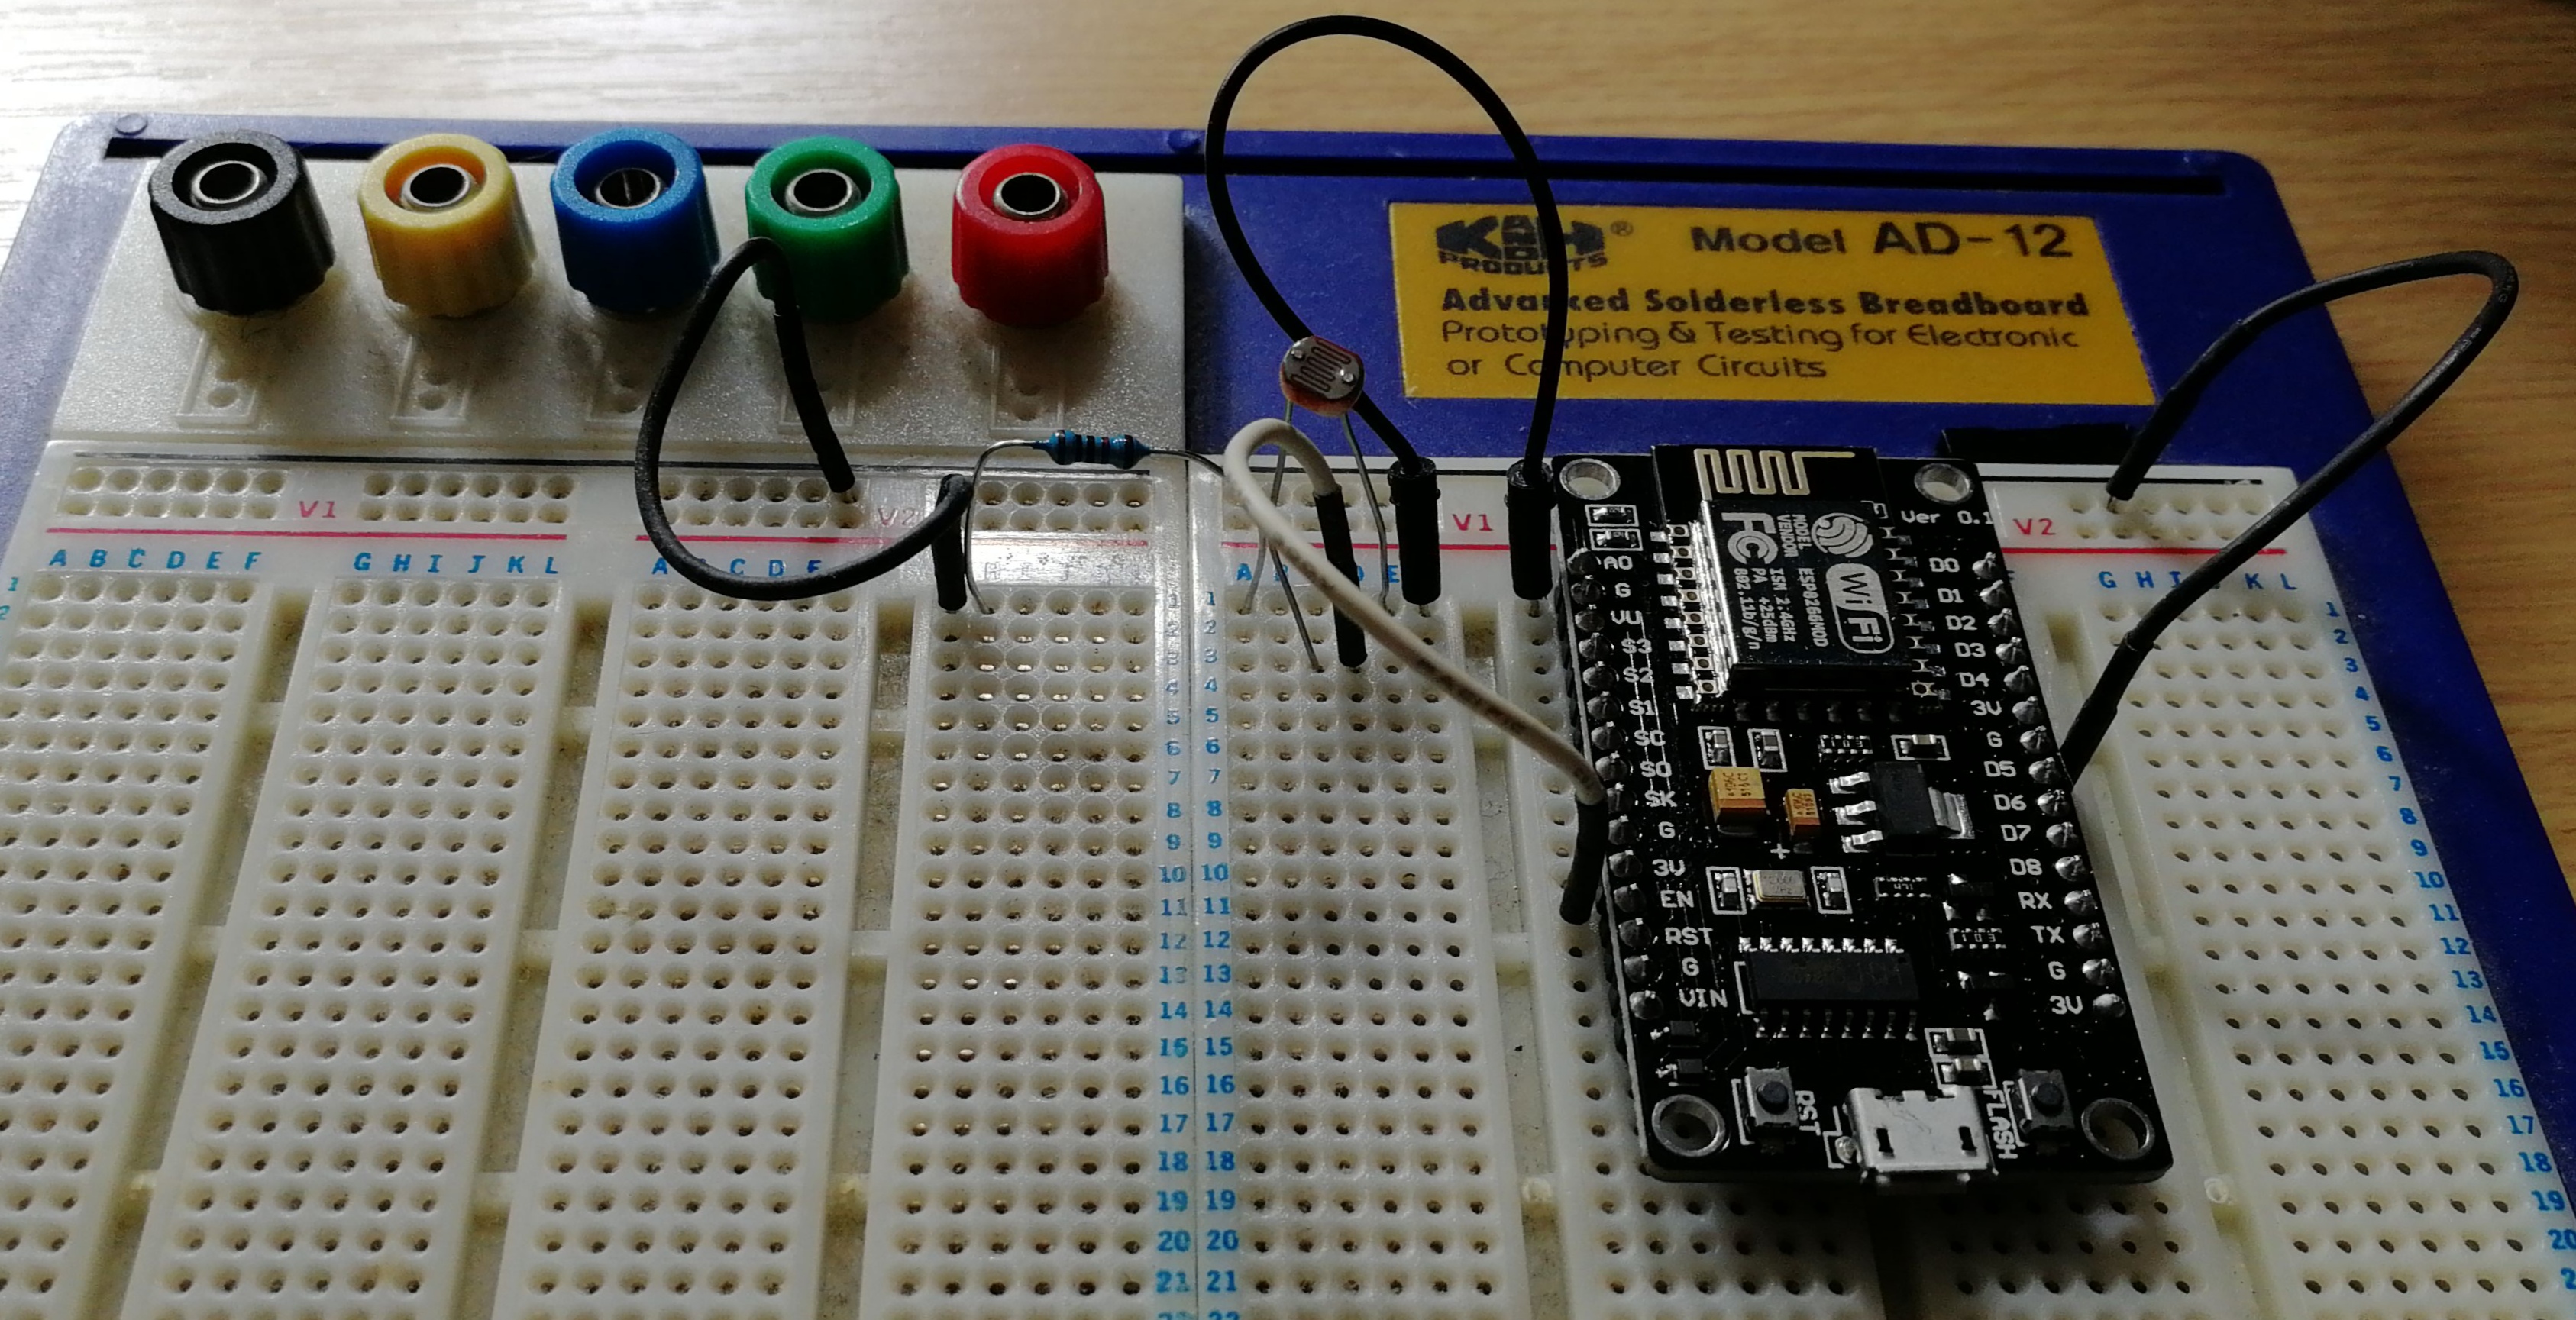 - Yes I did take the photo before I realised that the 2 halves of the breadboard were not connected 🤦♂️
Pulse Counting
Now we have the hardware ready to go, we need to work out how to record the LED flashes and get something useful from the aggregation of those flashes. To do this we should pass a message on to a central server for storage and / or processing. To do this we need to choose a suitable messaging or queuing system, and an appropriate message broker (the server component). My choice of messaging technology for this task is MQTT. This protocol is designed for IoT and it has several lightweight implementations suitable for running on Ardunios. The broker of choice here is RabbitMQ which is an AMQP broker, but supports MQTT via a plugin.
I already have RabbitMQ setup for use with Home-Assistant and the ELK stack so its a great fit for my setup.
The Ardunio sketch is fairly simple and is mostly cobbled together from the sample code for the MQTT library and the WiFi library:
Im sure it could be optimised to read the pin value less frequently and perhaps enter a sleep state but I leave that as an excerise for the reader!
You may have noticed that the MQTT client sends a JSON payload as its message, this is parsed by logstash and we augment that information with another field indicating if the pulse was received during the period of cheap rate electricity.
if[type_name] == "electric_pulse" {
      ruby {
        code => "
testDate = event.get('@timestamp')

now = Time.now
startOfAfternoonCheapRate = Time.new(now.year, now.month, now.day, 14, 35,0)
endOfAfternoonCheapRate = Time.new(now.year, now.month, now.day, 16, 35, 0)

startOfEveningCheapRate = Time.new(now.year, now.month, now.day, 22,7,0)
startOfMorningNormalRate = Time.new(now.year, now.month, now.day, 7,7,0)

if (testDate >= LogStash::Timestamp.new(startOfAfternoonCheapRate) and testDate <= LogStash::Timestamp.new(endOfAfternoonCheapRate)) or
    (testDate >= LogStash::Timestamp.new(startOfEveningCheapRate) or testDate <= LogStash::Timestamp.new(startOfMorningNormalRate))
  event.set('rate','Cheap')
else
  event.set('rate','Normal')
end"
      }
    }
We then output the details to InfluxDb for later display with Grafana
if [type_name] == "electric_pulse" {
    influxdb {
        id => "electric_pulse"
        host => "192.168.1.12"
        db => "electric_pulse"
        measurement => "electricusage"
        data_points => {
            "light" => "%{light}"
            "impkwh" => "%{impkwh}"
            "rate" => "%{rate}"
        }
        coerce_values => {
            "light" => "integer"
            "impkwh" => "integer"
        }
        send_as_tags => ["rate"]
    }
}
Installation
To ensure that we get accurate readings and we need to shield the sensor from ambient light, liberal application of electrical tape did the job of holding the sensor over the LED and the Node MCU to the side of the meter.
Graphs
Now that we have data going into influxdb we can start to build some graphs. I setup a new dashboard and go to work.
The graphs are very much a WIP, I might come back and update this post as and when I get round to improving them. In the mean time here is whats currently displayed:
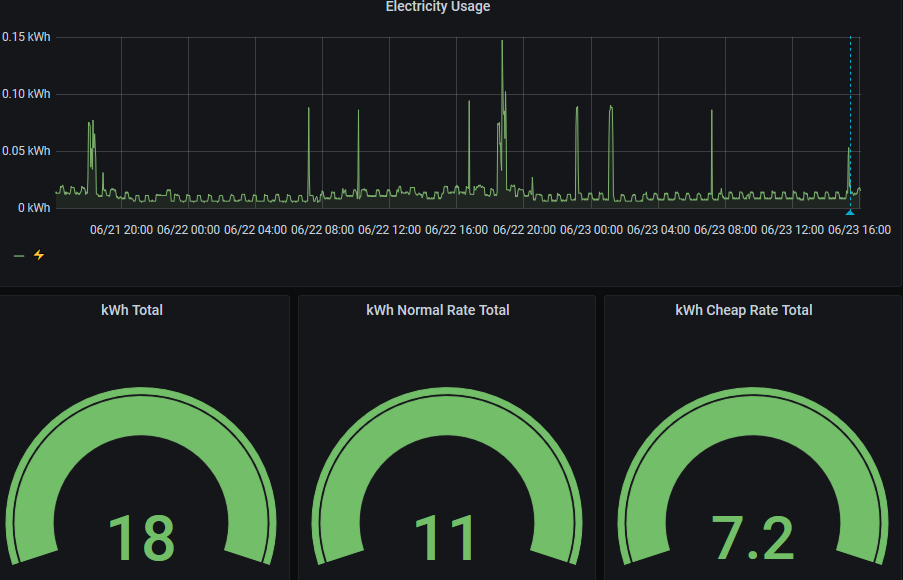
The query for the top graph is below:
SELECT count("impkwh") / 1000 FROM "electricusage" WHERE $timeFilter GROUP BY time($__interval) fill(null)
The guages need some work, but I am a Grafana noob and haven’t quite worked out how you set them up. I would like them to show how many kWh has been consumed compared with the historic average for the time interval specified, so if you know how to do this please leave a comment!